Mapping project illuminates links between poor environment, historical racism
A new tool that measures the environmental quality of any urban street in Canada — and maps it out in colour — illustrates vividly the many neighbourhoods in the country that have poor environment scores, neighbourhoods that are often home to racialized communities.
GoodScore assesses air quality, street greenness, amenities, transit and recreation on a scale of 1 to 100. The prototype tool was made for the public and policy-makers alike “so people can create evidence and stories that will illustrate inequity,” says Eleanor Setton, the Victoria-based managing director of the Canadian Urban Environmental Health Research Consortium.
“Bad” neighbourhoods have hazards that are linked to poor mental health, cancer, asthma, diabetes, and low birth weights.
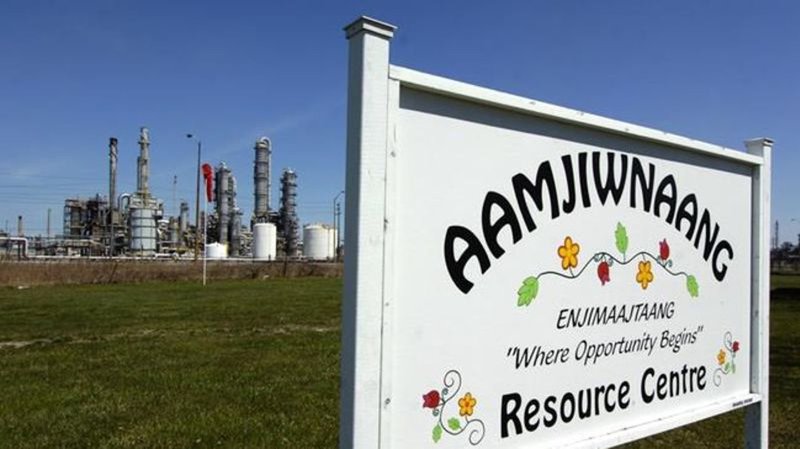
Homes in the Aamjiwnaang First Nation reserve, nestled in the midst of petrochemical plants in southwestern Ontario, most often record scores under 10 and appear in blazing red on the map. The neighbouring city of Sarnia shows scores of 50 and above and is presented in less alarming colours of tan and blue.


